


Here’s why the getting diesel drivers to switch to EVs should be a priority, for climate change and public health.
Diesel versions of a car produce less CO2 than petrol versions but…
Conventional wisdom is that diesel cars and vans produce 15% to 20% less CO2 than petrol vehicles, but CO2 from UK drivers of diesel cars is much higher than from drivers of petrol cars.
Under the old EU NEDC test, diesel versions of most cars did get a much lower official CO2 figure than petrol versions. The trouble is the NEDC test had some problems
- The EU NEDC test consistently understated the CO2 from diesel vehicles by a large amount. It also understated emissions from petrol cars but by a smaller amount
- the NEDC lab test was very easy to manipulate by carmakers. This manipulation got worse year by year and was greater on diesel vehicles. The same test resulted in extraordinary official fuel economy numbers that proved wildly optimistic and unachievable on the road. The result of the manipulation was that diesel drivers saved billions in vehicle taxes based on understated CO2.
- real CO2 benefit from most diesel cars is often more like 10% or less.
- Official CO2 from diesel cars in the new WLTP lab test may turn out to be much more accurate for diesels while still slightly understating the CO2 of petrol cars
- even assuming diesel cars are 15% lower per km than the same car there is still an issue. And its to do with diesel drivers.
Diesel drivers choose Bigger, heavier cars than petrol drivers
There are many factors that have as much or more influence on fuel economy and CO2 than the choice of fuel. Diesel drivers have a strong preference for bigger, heavier less efficient cars. Its almost as if diesel drivers are determined to wipe out any CO2 benefit that you might get by using a more efficient engine. There are efficient diesels like this Audi A2 diesel pictured.
But diesel owners don’t, on average, choose small or efficient diesel cars, they choose the opposite. In fact a diesel Audi buyer is far more likely to choose a car like the Audi Q5 pictured. If you switch from a petrol family hatchback to a “mid size” SUV then your CO2 goes up, not down.


The original 1980s 5 door Range Rover still looks like a big car, but it was 4.445m long as a short wheelbase to 4.648m as a long wheelbase. So in a diesel lineup today its size fits between an current Audi Q3/ BMW X1/ VW Tiguan and Audi Q5 or X3.

The current Audi Q5 is longer than the original long wheelbase Range Rover.
In fact some diesel SUVs are now so oversized there are 20 diesels bigger than a VW Touareg & 12 for buyers who think a a BMW X5 is too small.
So compared to petrol drivers, diesel drivers On average choose cars that are:
- bigger
- Much heavier
- often less efficient body styles
- using less efficient 4×4 transmissions
- From European luxury brands mostly from Germany, & Sweden & UK

A CO2 history – my 5 cars since the year 2000


- Mini Cooper 1.6L petrol (1st Gen BMW Model)
- BMW 330D 3L diesel estate car
- Range Rover Evoque 2.2 L Diesel SUV
- Skoda Karoq 1,5 TSI ( Petrol SUV]
- Tesla Model 3 Performance fully electric
All the petrol & diesel cars listed above had about the same fuel consumption. In a mix of London & longer journeys. They all averaged around 35mpg. Yes some were more economical in some places but the average was the same. Even between the heavier diesel Evoque compared to the lighter 2 wheel drive but same sized petrol Karoq.
That means they use the same number of litres of diesel or petrol as each other. As you will find out below that means all the diesel models I owned produced more CO2 than the petrol ones.
Diesel drivers drive spend more time on the road and drive further
This isn’t a big surprise. Diesels were always recommended as the best choice for high mileage drivers. In fact, because diesels cost more to buy than petrol cars and diesel fuel typically costs around 5p a litre more at the pump, most diesel drivers need to drive 20,000 miles before they break even on the higher costs.

“The estimated average annual mileage was higher for diesel cars than petrol cars, at 9,400 miles and 6,600 miles respectively in 2018.
Source: RAC foundation
Alternative figures from quoted in the Daily Telegraph using first MOT data from 3 year old cars were:
- petrol cars 7,490 miles a year
- electric cars 9,435 miles a year
- diesel cars 12,496 miles per year
There is more CO2 in each litre of diesel than in petrol
A diesel version of a petrol car will produce less CO2, but the 2 fuels do not produce the same amount of CO2. Each litre of petrol produces 2.31 kg of CO2. By contrast each litre of diesel produces 2.68kg of CO2 per litre of fuel, As you can see both below both fuels produce much more CO2 than the weight of the fuel itself.
1 liter of petrol weighs 750 grammes. Petrol consists for 87% of carbon, or 652 grammes of carbon per liter of petrol. In order to combust this carbon to CO2, 1740 grammes of oxygen is needed. The sum is then 652 + 1740 = 2392 grammes of CO2/liter of petrol.
So the fact each litre of diesel we burn in vehicles produces 16% more CO2 offsets much of the economy benefit of diesels. The EPA quotes the figure as 15%
Ok but where is the evidence that diesel drivers actually produce more CO2?
We have stats from the petrol retailers Association showing the sale of diesel and petrol in the UK in 2019. As you can see not only is more diesel sold than petrol, There is also a substantial amount of diesel fuel used commercially by van fleets as well as HGVs.
- Petrol – 16.2bn litres (Retail)
- Diesel – 20.8bn litres (Retail)
- Diesel – 9.5bn litres (Commercial)
Source: The UK Retail Road Fuels Market 2019 UK Gasoline and Diesel Sales Total road fuels –
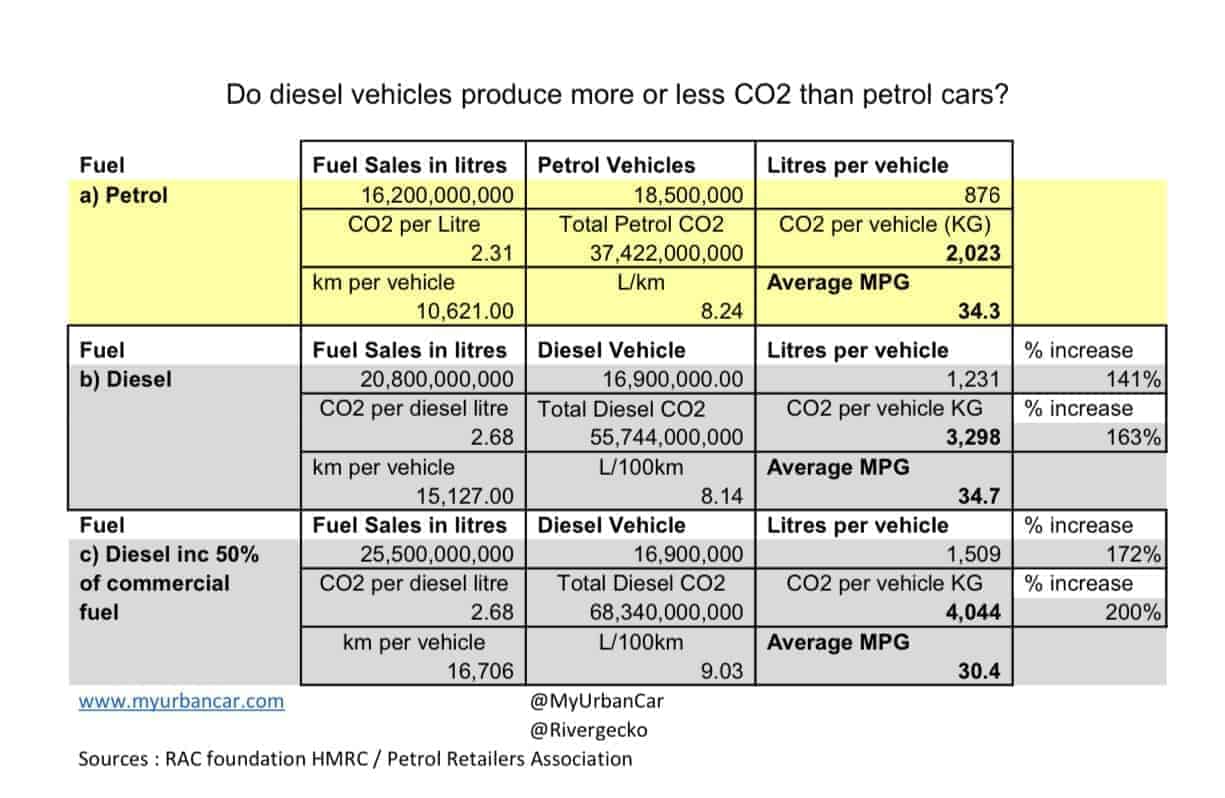
In the chart below we’ve calculated the CO2 based on fuel used for petrol and diesel cars in the UK.
We have explained the method below. As you can see the table indicates that on the most conservative calculation, b) each diesel driver produces on average 63% more CO2 than petrol drivers. We believe that scenario c) is actually more realistic and suggests that diesel drivers create double the CO2 in kilograms per year in the UK.
Explanation of the calculation
Fuel sales in litres – 2019 figures from the Petrol Retailers Association
Petrol / Diesel vehicles – Figures from the RAC foundation
Litres per Vehicle
For part a), petrol which is shown in yellow, we have simply taken the petrol sold in litres and divided by the number of petrol vehicles. The figures will, if anything to be slightly conservative, because some petrol will be used by motorcycles, petrol hybrid cars and by the small number of petrol vans – if we added these in the CO2 per petrol car would come down further.
For the diesel calculation in b) We have taken the total 2018 number of diesel cars which is 12.9 million and added 4 million for all vans in the UK. Again this should be a conservative way to calculate it as a few vans are in fact petrol. In part b) we took the average diesel car mileage.
For the calculation in part c) we show the CO2 per diesel vehicle if you assume that half of the commercial diesel fuel sales (100% being 9.5bn litres) are used to fill diesel vans. We think this is a reasonable estimate but it is just that. That therefore assumes that the other half of commercial diesel fuel is used in HGVs which are not included in our calculation. For c) we have also taken into account that the 4m diesel vans average 12,900 miles per year compared to 9,600 for diesel cars. This means the average mileage per diesel vehicle in C) is 10,381 miles or 16,706 km
CO2 per Litre – The CO2 per litre of petrol and diesels was just found using google and checking against different sources
Total petrol & diesel CO2 – simply CO2 per litre times fuel sold in litres
CO2 per vehicle in Kg – Total CO2 on all sales of the fuel divided by number of vehicles
Km per year for Petrol and diesel cars – Q25 the RAC foundation . Figures of 9,400 miles for diesel & 6,600 miles per petrol car have been converted into km.
Fuel economy in L/100km and MPG (miles per UK Gallon) based on the fuel used and mileage driven per vehicle
% increase shows how much more fuel per vehicle and CO2 per vehicle are produced by diesel car drivers compared to petrol car drivers.
Why this should effect policy
Looking at fuel consumption by the average fuel used per vehicle gives a very different perspective on the climate change benefits of diesel. We welcome any feedback on the calculations and the data sources we have used.
What does seem clear however is.. not only is the myth of diesels producing less CO2 just that, a myth. Even if it wasn’t if you had to work out whether to convert every diesel car and van driver to clean electric vehicles or start with drivers of petrol vehicles the answer is now clear.
All petrol vehicles combined in the UK consume 16.2 billion litres of fuel and produce 37.4 million tons of CO2.
Despite there being fewer diesel vehicles they consume between 20.8 billion to 25.5 billion litres of diesel and emit between 55.7m and 68.3m tons of CO2.
When you add in the cost of diesel on human health and the cost to the NHS it seems clear government incentives (both carrot and stick) should aim to get diesel drivers into clean vehicles powered by renewable energy as a priority.

[…] my article “the big fat diesel con, why diesel drivers produce more CO2 not less” I lay out the case why diesel drivers produce more carbon emissions and the sources for these […]
[…] any other type but do the most harm in both pollution (12x more than petrol drivers on average) and carbon emissions 2x compared to petrol. We would propose a 1-2 days a week free (4 to 8 days a month) allowance from the congestion charge […]
[…] while we wait for the future people have been reacquainting themselves with petrol cars. Petrol cars are much lower in NOx than the vast majority of diesels, and usually substantially cheaper to buy and maintain. Petrol cars are also now much closer on MPG […]
[…] while waiting for the future people reacquainted themselves with petrol cars. Petrol cars are much lower in NOx than the vast majority of diesels, and usually substantially cheaper to buy and maintain. Petrol cars had also now much closer on MPG […]